If you can't see your K-beauty shelf, it will move without you.
A note for brands and buyers. The same transparency that exposes a weak offer to shoppers exposes a blind spot to its owner. The brands that can see their whole shelf get to spend the next year on the product.
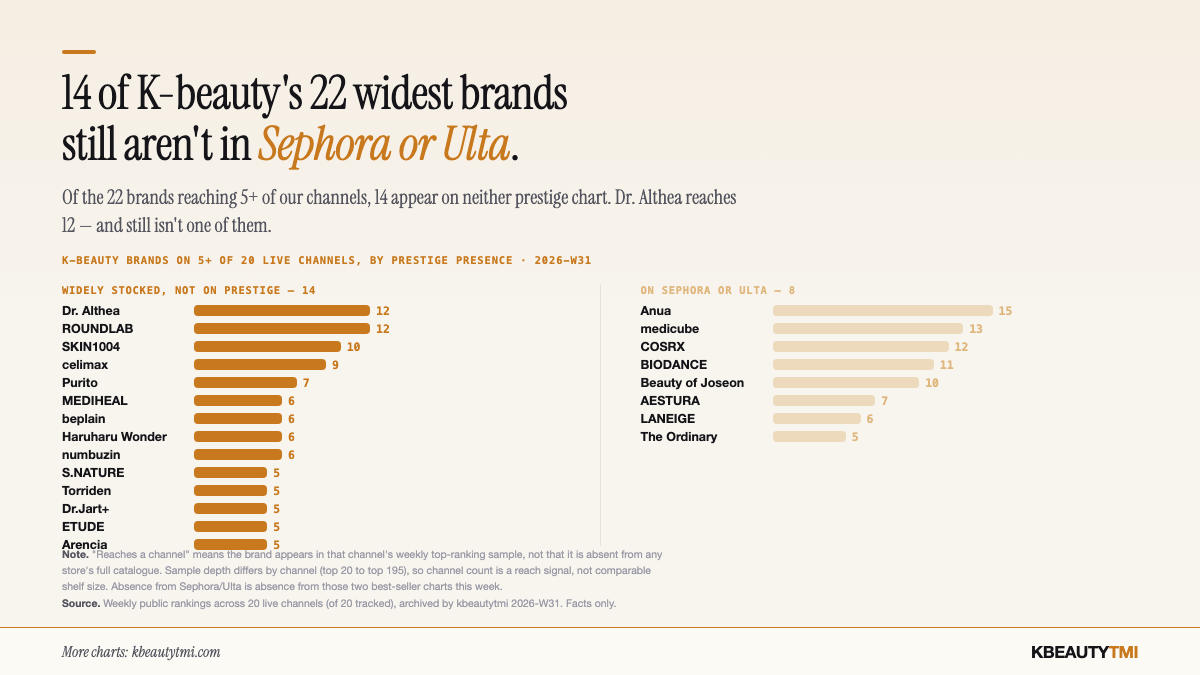
Following on from last week's note: if transparency is dissolving the old moat, the uncomfortable half is what it does to the people who can't see. A retail essay put it plainly this week — “If you can't see your market, it will move without you.” In K-beauty, that isn't abstract.
What “can't see” looks like here
A rival starts its promotion two weeks early and takes the demand you'd banked on. A downstream retailer breaks price and a marketplace matches it. Your product quietly slips off a channel's chart — and you find out from a customer, not a dashboard. Each of these is a change you experience as a surprise weeks later, then spend three days building a deck to explain. Meanwhile the shopper already saw the whole picture, in one line, from a tool they trust.
The blind spots are specific
Some of them are visible from outside a brand and invisible from inside it. This week, a set of K-beauty names are widely stocked across our channels yet appear on neither prestige chart — a position that reads very differently depending on whether you're the brand or the market. From inside, it looks like broad distribution. From the shelf, it looks like reach without the rooms that convert. You can't fix what you can't see.
The loop is the new moat
The brands pulling ahead have flipped one ratio: the machine does the collecting and the matching, and the people make the calls. Rich market data, combined with your own first-party numbers, feeding decisions in hours instead of quarters. That loop — not any single report — is the position. Once it runs, every campaign and every buy starts from a better place than last quarter's average. It compounds.
Where we sit in that
We're the market-read half of that loop for K-beauty: what's charting, where, how it's moving, and who AI is naming — archived weekly so it can't be reconstructed after the fact. We don't tell you what to launch. We tell you, honestly, what the shelf actually did — shelf position, not sales — so your best people spend their time deciding instead of compiling. That's the side of this we'd want to be on.
"If you can't see your K-beauty shelf, it will move without you." — kbeautytmi, 2026-W31. https://kbeautytmi.com/stories/cant-see-your-shelf
↗ Chart image — free to use with credit Free to cite — rankings can't be collected retroactively, so this archive exists nowhere else.